Search for content and authors
 

Theorems for Numerical Simulation of Solution Growth with Segregation and Fluid Flow

Hiromoto Susawa 

Home, Aichi 489-0888, Japan

Abstract

1. Introduction
    Solution growth contributes to mass production and is environment-friendly. The author originated light-emitting diodes (LEDs) made with Bragg reflectors constituted by semiconductor layers with metal organic vapor deposition [1, 2], which is a more dangerous technique than solution growth, and could enhance the light extraction efficiency, but the yield of product was limited because the thickness of each layer in a Bragg reflector required rigorous control all over a wafer. We needed more complicated structures with more layers to improve the yield [3]. On the other hand, a solid solution substrate offered a simple structure to enhance the light extraction efficiency. This substrate was transparent to light emitted from the active layer in LEDs. The electrode on the substrate could serve as a reflector. This solid solution substrate was produced with solution growth.
    However, in solution growth, the mole fraction of each component in liquid phase is different from that of its component in solid phase. We find the mole fractions by experiment after repeated trial and error. Numerical simulation reduces these experiments. Moreover, it offers finer understanding and can propose new techniques.
    When we grow a crystal on a substrate and do not dissolve the substrate on the initial growth, we supersaturate the liquid solution before the growth. When the growth has just started, the macroscopic model is singular. The liquid phase is in equilibrium with the solid phase on the growth interface, while mole fractions in the liquid phase have supersaturated values at the places except for the growth interface. The gradients of mole fractions at the growth interface are large for short growth times. This singularity causes a computational error. This error was recognized recently in an ideal case without fluid flow in the liquid solution [4].
    In a technique of solution growth, to start growth, the entire liquid solution is put into contact with the substrate relatively. This motion induces a fluid flow in the liquid solution. The effect of this flow lasts for short growth times.
    Moreover, the effect of fluid flow is important for short growth times. The growth lacks poorly soluble solutes rapidly. The fluid flow can supply them to the growth interface. For example, ammonothermal method is succeeding, utilizing fluid flow.
    The main effect of fluid flow on solution growth was discussed [5-8]. A manuscript of proceedings for [9] was received a comment, "For the sake of clarity, the materials whose compositions are affected by forced convection should be named. Generally, your model should be applicable all mixed crystals i.e. solid mixtures of group IV elements (Si and Ge), group III-V compounds (GaAs and InAs etc.), and group II-VI compounds.". This presentation reflects this comment, generalizes those discussions and shows a solute affected by fluid flow most strongly. This is a key solute to verify the computed result. In the text, this solute is named L. This presentation also reflects the comments of the manuscript for the conference last year [9] so that the content is not misunderstood.
    We recognized an open question whether a computed result should be verified with the experiment or the theory at the previous conference [10]. There is the following example of failure related to this question. A model was insufficient for the experiment, solved insufficiently and the computed result fit the experimental result but was against the mathematics. On the other hand, floating-point arithmetic causes errors due to the finite length of significand. Fore example, A = 1.0 + 1.0E20; B = 1.0E20; then, the result of ( AB ) is not 1.0 on the conventional computer. We cannot take complete measures against the errors. When we employ an experimental result for verifying a computation and do not use employ the experimental result for verifying the model, the experiment deviates from the original role. In this case, the experiment is employed as an analog computer. We have to have already known the property of each device in the analog computer. The circuit has to match the model. However, we usually do not expect it because we experiment for the phenomena that we have not known well. Therefore, we answer that question at the present time as follows. We can apply the experiment to verifying the model but it is better to theoretically verify the computation executed to solve the model than to apply the experimental result for verifying the computation. Then, this presentation shows theorems to interpret computed results qualitatively.

2. Nomenclature
    Fig. 1a shows the coordinate system. The origin is defined to be at the center of the growth interface. The x-axis and z-axis are defined to be parallel and perpendicular to the growth interface, respectively.
    In this abstract, some symbols deviate from the conventional nomenclature for the printing reason.
    The presentation uses the conventional nomenclature, e.g., XLl*.
—————

Fig. 1a. Coordinate system.
b. ΔXL and ΔXM in the boundary layers at enhancement of growth from inhibition of growth by fluid flows. The concrete model is the same as Ref. 6 except for the phase diagram approximated linearly by directly reading that in Ref. 11. This simulation was modeled on InGaP growth from indium melt. L = P. M = Ga. x = 0. t = 0.278 s.
————
DL, DM  the diffusion coefficients for components L and M in the liquid solution, respectively  (m2/s)
h  the length of liquid solution in the z direction  (m)
L, M  the most and less affected components by fluid flow, respectively  (-)
NL  ( XLXL0 ) / ( XLbXL0 )  (-)
NL( x, z, tNL at x, z, and t  (-)
NM  ( XMXM0 ) / ( XMbXM0 )  (-)
NM( x, z, tNM at x, z, and t  (-)
pL, pM  ∂XL /∂z and ∂XM / ∂z at the growth interface, respectively
r   ratio of volume per unit atom in the liquid to that in the solid
sqrt( ξ )  the square root of ξ   ( the square root of the unit of ξ )
t  a growth time  (s)
u, w  the x and z components of the fluid flow velocity, respectively
XL, XM  the mole fractions of components L and M in the liquid phase, respectively  (-)
XL( x, z, tXL at x, z, and t  (-)
XL0, XMXL and XM when growth has just started, respectively
XLb, XMb  XL and XM just before growth, respectively  (-)
XM( x, z, tXM at x, z, and t  (-)
YL, YM  the mole fractions of components L and M in the solid phase, respectively  (-)
YL0, YMYL and YM when growth has just started, respectively  (-)
ΔXL  XL( x, z, t ) - XL( x, 0, t )  (-)
ΔXL( x, z, tΔXL  at x, z and t  (-)
ΔXM  XM( x, z, t ) - XM( x, 0, t )  (-)
ΔXM( x, z, tΔXM  at x, z and t  (-)
δL, δM  the boundary layer thicknesses of XL and XM, respectively

3. The base of Model
    We deal with the growth of a ternary solid solution from a liquid solution. We assume the growth interface is in an equilibrium state. During the growth, the temperature is uniform and constant, i.e., the phase diagram is fixed. XL << YL. XM << YM. δL << h. δM << h.
    Mole fractions in liquid phase are the most important parameters to determine segregation. This presentation discusses only the effect of fluid flow on segregation.
    It is assumed the solid solution grows only at z = 0.

4. Mass transfer through growth interface [12]
DL ( pL ) / DM / pM  
= [ r ( YL ) − XL( x, 0, t )] / [ r ( YM ) − XM( x, 0, t )].  (1)

5. Known Theorem
    We can approximate h to be infinite in order to use analytic solutions [13].
Theorem 1: Theorem 1 assumes that the solutes are transported only by diffusion in the liquid solution, the base of model and diffusion-limited model. Mole fractions are approximated to be constant on the growth interface.

6. The benefits of normalizations, NL and NM

  • The normalized values on the growth interface express the effect of fluid flow. The reason is as follows: on the growth interface, the mole fractions approximately have the values when the growth has just started from Theorem 1; then, the normalized values are zeros on the growth interface without fluid flow.
  • The normalized value of a component can be compared with that of another component based on the initial supersaturation state.

7. Assumptions related to fluid flow
    The model is in the xz plane. DL > DM. The fluid flow traverses the boundary layers of mole fractions. Velocity perpendicular to the boundary of fluid flow is zero. Discussion starts with the mole fractions without the fluid flow.

8. Theorems by generalizing a series of these studies [5-9]
8.1 Enhancement of growth by fluid flow
Case 1: A liquid solution retaining the initial supersaturated state in an outer region of the boundary layers of XL and XM flows to their boundary layers.
————
Theorem 2: Theorem 2 deals with Case 1 and assumes the base of model and assumptions related to fluid flow.
    Then, the fluid flow increases XL( x, z, t ) more than XM( x, z, t ) around the border between their boundary layers and the outer region of the boundary layers.
Reason:
    Fig. 1b is an example to show the profiles of mole fractions in their boundary layers. Fig. 2 characterizes the boundary layers. This figure defines positions, e and f. Position e is in an outer region of the boundary layers. Position f is inside the boundary layer of XL and outside the boundary layer of XM. Suppose that a block of liquid solution retains the initial supersaturated state at Position e and t = t1, and comes to Position f at t = t2.
    Fig. 2a illustrates how the fluid flow affects XL. The fluid flow transports a block of liquid solution in which XL has XLb to the boundary layer. A1 = A2 + A3. XL( x, Position f, t2 ) increases by the amount proportional to Area A2.
    Fig. 2b illustrates the effect on XM. The relation between Area A4, A5 and A6 is A4 = A5 + A6. The fluid flow increases XM( x, Position f, t2 ) by the amount proportional to Area A5. The effect on XM is smaller than the effect on XL because the profile of XM was more saturated to its initial value than that of XL at t1.
    Obviously, the above geometric discussion can be expanded to three-dimensional space. The upstream position and destination do not need to be along the z-axis.
————
    The following becomes an index to verify the computed results. It is obvious form Fig. 2.
Theorem 3: Theorem 3 uses the assumptions and result of Theorem 2. The fluid flow decreases δL and δM.
————
    From Theorem 3, this fluid flow enhances the growth.
    The following is a preparation for the next theorem.
Proposition 1: The fluid flow increases XL and decreases XM on the growth interface.
————
Theorem 4: Theorem 4 uses the assumptions and results of Theorem 2 and 3. Theorem 4 assumes the result of Theorem 2 propagates to the growth interface and  dXM / dXL < 0 on the liquidus line.
    Proposition 1 is valid under Eq. 1.
Reason:
    From Theorem 3, pL and pM increase. The increase of XM is less than that of XL in the vicinity of growth interface because the result of Theorem 2 propagates to the growth interface. The left hand side of Eq. 1 is greater than the right hand side if the equilibrium state remains constant. On the other hand, on the growth interface, XL and XM are on the liquidus line; then, when XL increases, XM decreases. The increase of XL on the growth interface contributes to the decrease of pL. The decrease of XM on the growth interface contributes to the increase of pM. That is, this change of equilibrium state contributes to the adjustment of the left hand side of Eq. 1 to the right hand side. Fig. 4a is examples of NL profiles in the boundary layers of XL. These profiles show how XL varies in z direction. Fig. 4b shows NL in the vicinity of growth interface. On the growth interface, “dYL / dXL > 0 or dYM / dXM > 0” is obvious. Suppose XL increases on the growth interface. Then, YL increases and YM decreases. YL >> XL. YM >> XM. Then, the right hand side in Eq. 1 increases. Therefore, the increase of XL on the growth interface decreases (the left hand side) - (the right hand side). At a certain value of XL on the growth interface, the left hand side balances with the right hand side. When suppose XL decreases on the growth interface, by repeating the similar consideration, we find Eq. 1 is not satisfied. That is, Proposition 1 is valid under Eq. 1.
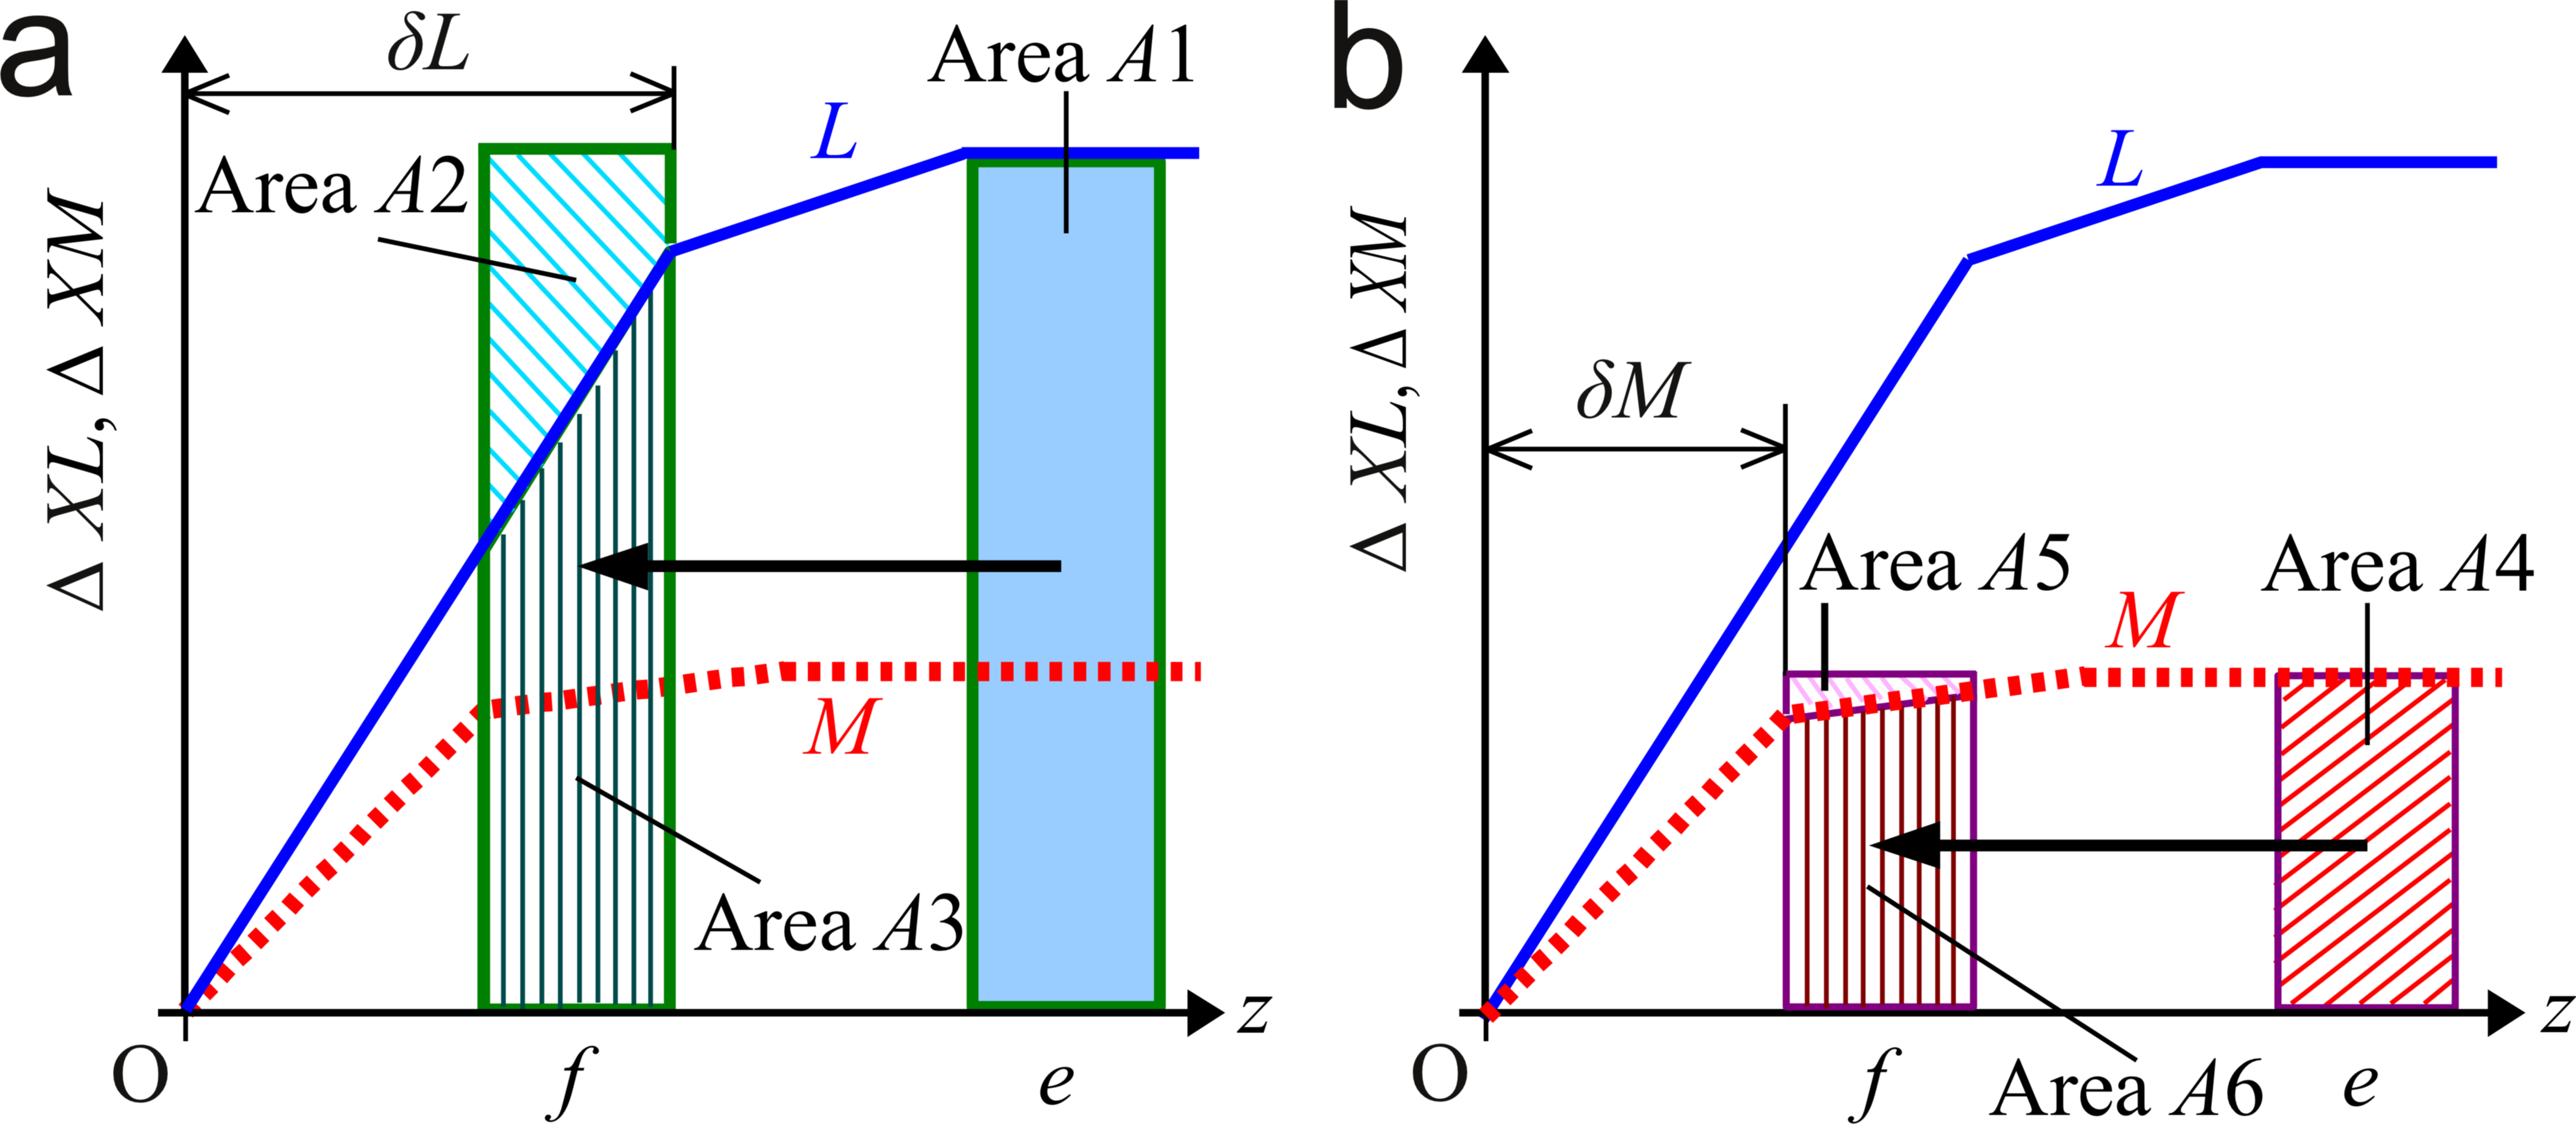
Fig. 2. Schematic illustration of the effect on the boundary layers by a fluid flow. Position f is inside the boundary layer of XL and outside that of XM. Suppose a liquid solution retaining the initial supersaturated state flows to Position f : (a) Effect on the boundary layer of XL, (b) Effect on the boundary layer of XM.
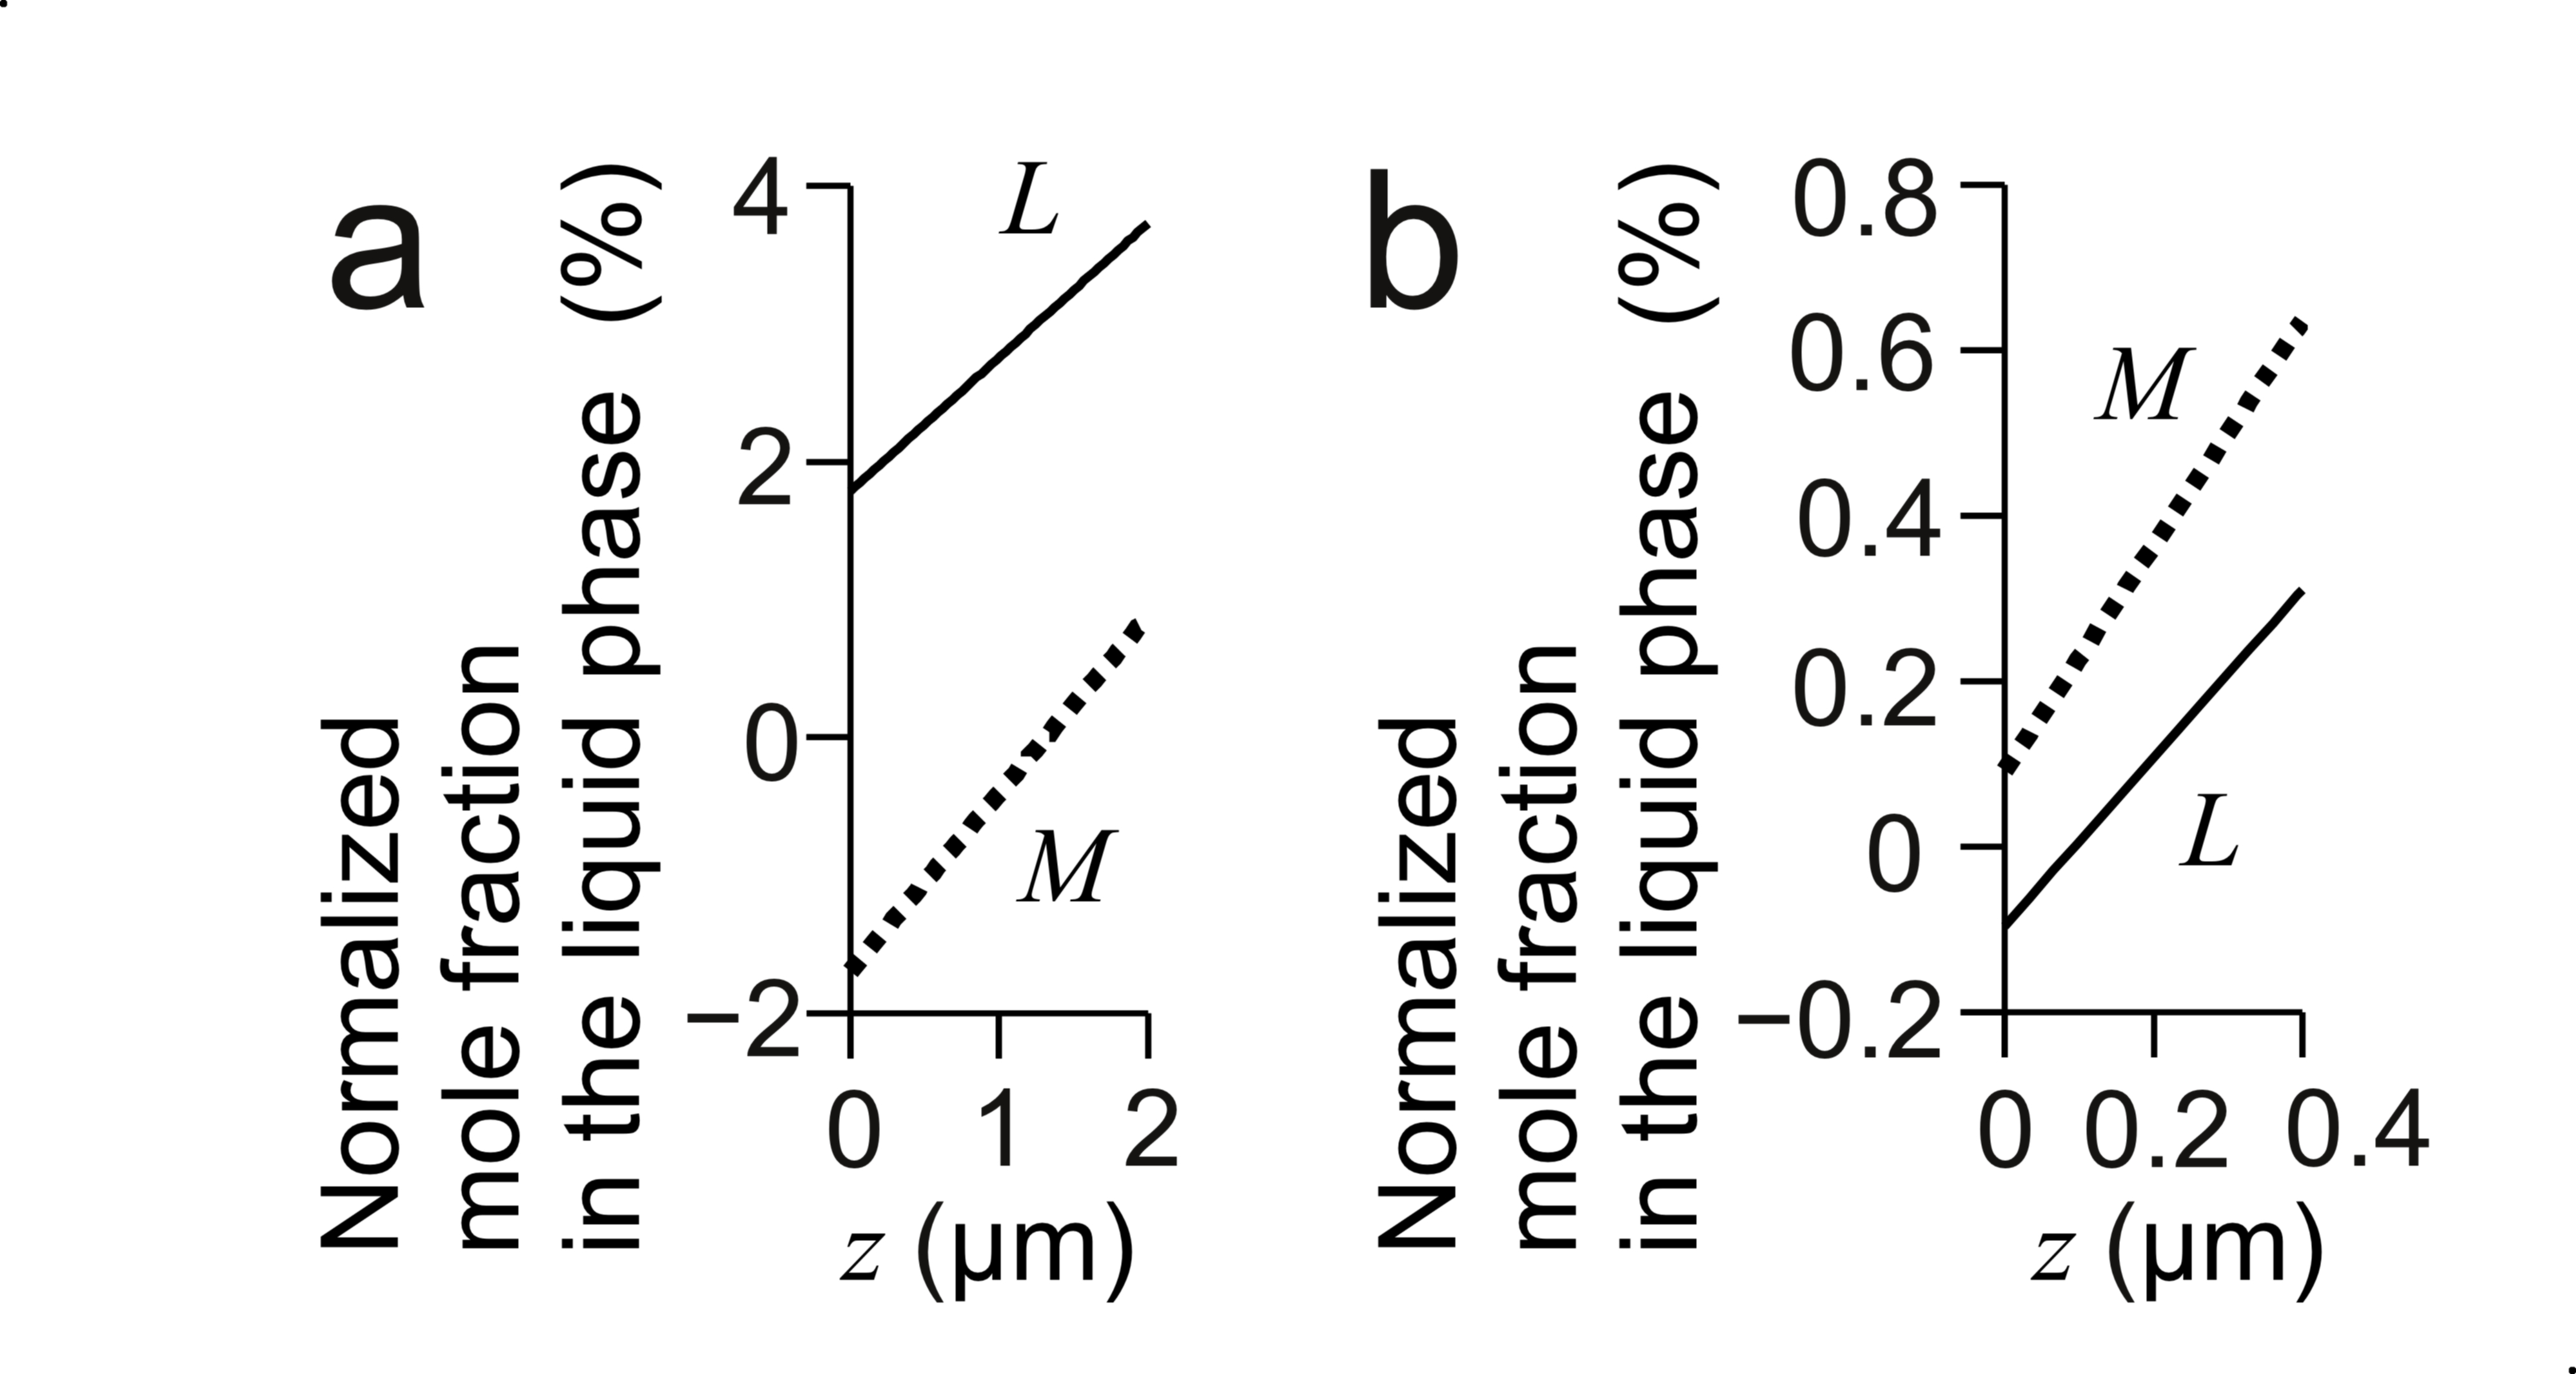
Fig. 3. Examples of normalized mole fractions in the liquid phase on the line, x = 0 near the growth interface Concrete model is the same as that in Fig. 1b. (a) The enhancement of growth by fluid flow at t = 0.278 s. (b) The inhibition of growth by fluid flow at t = 0.12 s.

8.2 Inhibition of growth by fluid flow
Case 2: The direction of a fluid flow is from the growth interface to an outer region of the boundary layers constituted by the mole fractions of solutes.
————
    Case 2 is opposite to Case 1. We find out the reasons with the similar procedures. The fluid flow inhibits the growth. We move the control volumes form Position f to Position e in Fig. 2. The conclusions are opposite to those in Case 1.  
Theorem 5:  Theorem 5 deals with Case 2 and assumes the base of model and assumptions related to fluid flow.
    Then, the fluid flow decreases XL( x, z, t ) more than XM( x, z, t ) around the border between their boundary layers and the outer region of the boundary layers.
Theorem 6: Theorem 6 uses the assumptions and result of Theorem 5. The fluid flow increases δL and δM.
Proposition 2: The fluid flow decreases XL and increases XM on the growth interface.
Theorem 7: Theorem 7 uses the assumptions and results of Theorem 5 and 6. Theorem 7 assumes the result of Theorem 5 propagates to the growth interface and dXM / dXL < 0 on the liquidus line.
     Proposition 2 is valid under Eq. 1.

References
[1] H. Susawa, M. Hirotani, T. Kato, Surface Emitting LED with Reflector on GaAs, 1989 fall 50th meeting held by Jpn. Soc. Appl. Phys. 28 p-ZB-10 (in Japanese)
[2] T. Kato, H. Susawa, M. Hirotani, T. Saka, Y. Ohashi, E. Shichi and S. Shibata, J. Cryst. Growth, 107 (1991) 832.
[3] N. Yamauchi, T. Saka, M. Hirotani, T. Kato, and H. Susawa, European Patent Office, Patent Number: EP0483868B1 (Issue Date: January 22, 1997).
[4] H. Susawa, T. Tsuji, T. Jimbo, T. Soga, J. Chem. Eng. Jpn. 40 (2007) 928.
[5] H. Susawa, T. Tsuji, K. Hiramatsu, T. Jimbo, T. Soga, Simulation of InGaP Liquid Phase Epitaxy Including Convection, Theor. Appl. Mech. Jpn. 55 (2006) 279-284.
[6]  H. Susawa, T. Tsuji, K. Hiramatsu, T. Jimbo, T. Soga, DOI http://dx.doi.org/10.2197/ipsjdc.3.114.
[7] H. Susawa, Numerical simulation of compositional variation in liquid phase epitaxy focusing on the forced convection in the melt, 16th Int. Conf. Cryst. Growth (2010) Sess.: 01 Aug. 11.
[8] H. Susawa, Leibniz Inst. Cryst. Growth (IKZ), abstract book 5th Int. Workshop Cryst. Growth Technol., Berlin, (2011) 61.
[9] H. Susawa, Proc. 7th Int. Workshop Model. Cyst. Growth, Dep. Chem. Eng., Natl. Taiwan Univ., (2011) 103.
[10] Panel discussion at the 55th Natl. Congr. Theor. Appl. Mech. in Kyoto Jpn. (2006).
[11] K. Hiramatsu, S. Tanaka, N. Sawaki, I. Akasaki, Jpn. J. Appl. Phys. 24 (1985) 1030.
[12] I. Crossley, M.B. Small, J. Cryst. Growth 15 (1972) 268.
[13] M. Feng, L.W. Cook, M.M. Tashima, G.E. Stillman, J. Electron. Mater. 9 (1980) 241.


Legal notice
  • Legal notice:
 

Related papers

Presentation: Poster at 17th International Conference on Crystal Growth and Epitaxy - ICCGE-17, General Session 1, by Hiromoto Susawa
See On-line Journal of 17th International Conference on Crystal Growth and Epitaxy - ICCGE-17

Submitted: 2013-04-12 16:55
Revised:   2013-06-23 20:44