Quantity of FWHM(Full Width at Half Maximum) is a commonly
used crystallographic parameter, mainly due to clear definition and
ease of determination. In case of crystalline powders containing grains
of same size (mono-dispersive), there exists a simple relation between
FWHMand the grain size, called Scherrer equation. In a more realistic
case of polidisperse powders, single parameter FWHM is not sufficient
to determine both properties of Grain Size Distribution: it's average
<R> and dispersion ![]() . In order to derive two unknowns,
two equations are needed - that's why determination of full Grain
Size Distribution requires two line widths to be used:
. In order to derive two unknowns,
two equations are needed - that's why determination of full Grain
Size Distribution requires two line widths to be used:
![]() and
and
![]() - measured at
- measured at ![]() and
and ![]() of line maximum, respectively.
of line maximum, respectively.
Detailed derivation of
![]() method is skipped
here and can be found in [1].
method is skipped
here and can be found in [1].
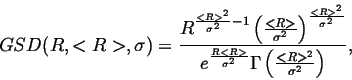
We assume gamma Grain Size Distribution of crystallites:
We present expressions that can be readily used in order to
obtain average size1 of the grain in a powder and dispersion of the GSD as
a function of measured values of
![]() and
and
![]() :
:
![\begin{eqnarray*}
A & = & arcctg\left[277069-105723\frac{FW\frac{1}{5}M}{FW\frac...
...eft[0.002237-2101\cdot A\right]\\
C & = & -0.6515-463695\cdot A
\end{eqnarray*}](img35.png)
|
Another example of usage of the
![]() is given
on Fig.3. It shows standard GSD evaluation for BN nanocrystals
from profile of (111), (220) and (311) diffraction lines. Standard
deviations do not exceed 1% for average sizes determined and 4%
for dispersions. Such a small deviations are due to good quality of
diffraction data (smooth experimental curves).
is given
on Fig.3. It shows standard GSD evaluation for BN nanocrystals
from profile of (111), (220) and (311) diffraction lines. Standard
deviations do not exceed 1% for average sizes determined and 4%
for dispersions. Such a small deviations are due to good quality of
diffraction data (smooth experimental curves).
|
In next section a practical supplement to the
![]() method is presented. It allows for direct application of parameters
obtained during fitting Pearson7 curve to the experimental peak profile.
Curve Pearson7 is commonly used in popular crystallographic software.
method is presented. It allows for direct application of parameters
obtained during fitting Pearson7 curve to the experimental peak profile.
Curve Pearson7 is commonly used in popular crystallographic software.


![\includegraphics[]{eps/sic-gsd120-0.5-1-prand0-0.eps}](img36.png)
![\includegraphics[]{eps/sic-gsd120-0.5-1-prand0-0-FW145M(111).eps}](img37.png)
![\includegraphics[]{eps/sic-gsd140-0.5-1-prand0-0.eps}](img38.png)
![\includegraphics[]{eps/sic-gsd140-0.5-1-prand0-0-FW145M(111).eps}](img39.png)
![\includegraphics[]{eps/sic-gsd200-0.2-1-prand0-0.eps}](img40.png)
![\includegraphics[]{eps/sic-gsd200-0.2-1-prand0-0-FW145M(113).eps}](img41.png)
![\includegraphics[ clip,
keepaspectratio]{eps/bnt35_q_220.eps}](img42.png)
![\includegraphics[ keepaspectratio]{eps/bnt35.eps}](img43.png)