| Search for content and authors |
Wear behaviour 3D AFM roughness of sintered nanomaterials produced by hot isostatic pressing (HIP) |
| Sayah Tahar 1, Hamouda Khaled 1, Babichev Anatoly 2 |
|
1. Université des sciences Houari Boumedienne (U.S.T.H.B), Bp N°9 El AliA Bab Ezzouar, Alger 16141, Algeria |
| Abstract | ||||||||||||||||||||||||||||
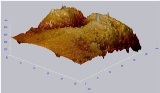
We propose an experimental study of the surface to dry and analysis of the evolution parameters roughness. The simplified model was proposed to predict the metrological parameters in the contact area of the deformed surface. The model is based on the analysis of the topography 3D of the deformed surface. The hot isostatic pressing (HIP) is the only process that will develop fully dense samples, From Fe,Cr,Mo,Ni,Ti,W powder. This sample is hot pressed at 1500°C under 150Mpa of argon pressure. Moreover, the grain size of the consolidated samples was analyzed by SEM, ABSD and optical microscopy. Study aims to characterize the topography of sintered materials obtained by wear tests. Therefore it is interesting initially in the evolution of wear for the loads applied and to characterize the different roughness emerging from 3D AFM observations. Experimental and theoretical research on the topography changes during dry contact deformation was carried out, providing results that demonstrate the persistent nature of roughness asperities even under high loading when bulk plastic deformation appears. Most theoretical investigations of the problem have been based on a simplified model neglecting the statistical distribution of asperities on the real surface. The test used and the 3D measurement of the surface topography to study the friction behavior. The mechanism of contact of a rigid plane with a rough surface in the presence of a lubricant is different than in the case of dry contact. The topography of the samples was measured both in initial undeformed and in the deformed state after removal of the load. In these states, however, a change of the shape of the samples when compared to the initial state was observed. Thus, prior to the determination of roughness parameters of the deformed surfaces, their curvature was removed using a filtration procedure. The essential differences in surface topography of samples loaded in dry condition are confirmed in the analysis of roughness parameter evolution. The following 3D parameters were considered: In the unloaded state, flattened asperities can be observed on the deformed surface Fig 1.
Figure 1: measurement 3D of surface topography in order to investigate its frictional behaviour.
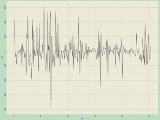
The real contact area corresponding to the maximal load attained in the surface compression experiment can be identified from measurement of the deformed roughness after unloading. The identification of the real contact area was carried out using a special algorithm based on single profile analysis. The single, randomly selected profiles, i.e., their coordinate’s xi, zi, were extracted from the measured topography of the deformed surface. It should be noted that the profiles obtained in this way have a common reference level Fig 2. The selected profiles also have the same direction, which, in the case of anisotropic surfaces (turning, grinding) should be perpendicular to the direction of the movement of the machining tool.
Figure 2: Profile corresponding to real area The proposed model was applied to analyze a wear of four kinds of rough surfaces. The predicted values were compared with experimental results Table 1. Table 1: Roughness parameters of the deformed surfaces of the samples figure 1.
The wear and surface roughness based on the parameters of dry friction tests were measured. This study suggested the optimal parameters of chemical composition, and analysis of the effects of alloying elements on surface roughness and wear in the process dry friction tests.
| ||||||||||||||||||||||||||||
| Legal notice |
|
Presentation: Poster at Nano PL 2014, Symposium A, by Sayah TaharSee On-line Journal of Nano PL 2014 Submitted: 2014-05-18 09:57 Revised: 2014-05-18 10:58 |