Abstract
Single crystals of bismuth tellurite (Bi2TeO5) were grown by a double crucible Czochralski method at different pulling and rotation rates, ranging from 0.1 mm/h to 0.8 mm/h and from 5 to 20 rpm, respectively. Growth conditions were studied and the crystallized phase was verified by X-ray diffraction. Crystals were oriented by X-ray back-reflection Laue photographs and good crystalline samples were cut and polished, presenting uniform pale yellow coloration. They were investigated by optical transmission and holographic recording.
1. Introduction
Bismuth tellurite (Bi2TeO5), here labeled BTeO, shows interesting linear and nonlinear optical and electro-optical properties, being a promising photorefractive crystal [1-3]. Bi2TeO5 was firstly synthesized in 1971 by Frit et al. [4], but just in 1990 the first detailed report on bulk single crystal growth using Czochralski method was published by Földvári et al. [5]. Since then, other methods like floating zone [6] and Bridgman [7], in addition to Czochralski [8, 9], were also used to grow pure and doped BTeO crystals. Bi2TeO5 crystallizes in an orthorhombic structure, with non-centrosymmetric space group Abm2, and unit cell parameters a =11.602(2) Å, b = 16.461(3) Å and c = 5.523(1) Å [2, 10]. It is a biaxial negative crystal with refractive indices n1=2.3203(3), n2=2.3678(3) and n3 = 2.4022(3), at λ=632.8 nm [3]. The (100) crystallographic plane is easily cleavable producing mirror-like surfaces [5].
The high vapor pressure of TeO2 at the melting point of Bi2TeO5 and the easy cleavage through (100) plane impose some additional difficulties for crystal growth of BTeO. In this work we adopted a double crucible Czochralski method to overcome the trouble of TeO2 evaporation, and a low rotation speed combined with an appropriate crystal seed orientation was used to minimize the risk of cleavage during growth. Homogeneous and pale yellow in color single crystals of Bi2TeO5 were grown and preliminarily characterized by optical and structural techniques.
2. Experimental
2.1. Crystal growth
Bismuth oxide (Bi2O3, Sigma-Aldrich, 99,999%) and tellurium oxide (TeO2, Sigma-Aldrich, 99,99%) were used as starting materials. They were mixed in the molar ratio of 1Bi2O3:1.1TeO2 and pre-synthesized by solid-state reaction, in order to minimize the partial loss of TeO2 during the melt. The synthesis was carried out in two steps, the first at 650oC and the second at 750oC, both during 24 hours, being the result monitored by X-ray powder diffraction.
A double crucible system consisting of two concentric cylindrical crucibles (platinum-5% gold) whose walls were separated by about 4 mm was used. The inner crucible was filled with the previously synthesized precursor powder, and the space between them was filled with a lower melting point powder with composition 3Bi2O3:7TeO2, richer in TeO2. At the growth temperature, the evaporation of tellurium oxide is higher in the outer crucible, producing a saturated atmosphere of TeO2 near the liquid surface from which the crystal is grown. The resulting condition of dynamic equilibrium between the vapor and liquid phases prevents high deviations in the melt stoichiometry, sustaining the crystal growth for a long time.
Crystal growth was performed on seeds oriented along [001] direction, keeping the cleavage plane in the vertical to prevent breaking during growing. Oriented seeds were obtained by nucleation on platinum wire, followed by crystallographic orientation and cutting. A resistive furnace equipped with a 2416 Eurotherm microprocessor-based digital temperature controller unit attached to a Pt-Pt10%Rh thermocouple was used, presenting temperature stability better than 0.2 oC and axial temperature gradient above the melt of about 30 oC/cm. The growth system is equipped with a pure platinum seed holder controlled by an accurate pulling and rotation system. All runs were carried out in air and the pulling and rotation rates were kept constant in each experiment during the entire process, being the furnace temperature adjusted to control the crystal diameter.
2.2. Characterization
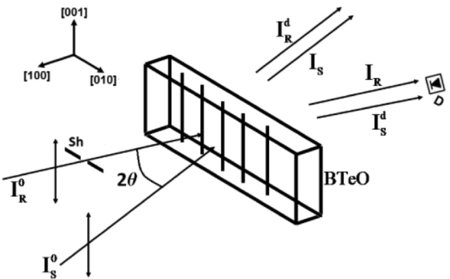
X-ray diffraction (XRD) analyses were carried out on a Shimadzu XRD-6000 diffractometer using CuK radiation (step size 0.02o and 5 s counting time), and for Rietveld refinement the software GSAS [11] was used. Differential thermal analysis (DTA) and thermogravimetric analysis (TG) were performed in a Shimadzu DTG-60H. Optical transmission spectra were measured in a PerkinElmer Lambda 1050 spectrophotometer. Electron micrograph and microanalysis were carried out on a Jeol JSM-6610 scanning electron microscope (SEM) equipped with an energy dispersive X-ray spectrometer (EDS). Holograms were recorded using direct λ = 532 nm laser beams in the experimental setup schematically shown in Fig.1. 
Figure 1 - Schematic illustration of the recording setup: BTeO is the crystal, IS0 and IR0 are the two recording beams, the former one referred to as the “signal beam” and the latter as the “reference beam”, ISd is the diffracted signal beam that is measured using the photodetector D, once the incident reference beam is cut off using the shutter Sh.
3. Results
Using the experimental conditions described above crystals were grown at different pulling and rotation rates, ranging from 0.1 mm/h to 0.8 mm/h and from 5 to 20 rpm, respectively. The use of the lower pulling rates proved unsuitable because of the long time required for crystal growth and the resulting problems in maintaining the melt composition. On the other side, the use of the higher rates favored the occurrence of defects like voids and inclusions. Such defects can originate from constitutional supercooling effects close to liquid/crystal interface because the differences in melt and crystal compositions, the first is richer in TeO2, and the low axial thermal gradient. An intermediate pulling rate of 0.3 mm/h showed the best results.
In order to minimize the probability of cleavage during crystal growth, it was tried the use of low rotation rates. But rates less than 10 rpm was not sufficient to ensure liquid homogeneity close to the surface, unlike a stagnant layer with composition deficient in TeO2 was formed. This layer enveloped the crystal as it grew, solidifying as a polycrystalline cape around it, as shown in Figure 2. The black drawn lines in that figure separate the bulk of crystal and the cape, whose microstructure shows the grain boundaries typical of polycrystalline ceramics, as can be seen by the SEM micrograph in the insert. The Te/Bi ratio measured by SEM/EDS is 0.33 in the cape, below the value of 0.50 for the crystal. The formation of an opaque layer at the outer surface of BTeO crystal, maybe with a similar origin, was also reported in ref. [8]. In our case the combination of double crucible to minimize the loss of TeO2, and a 15 rpm rotation rate was effective to suppresses this defect. 
Figure 2 - Image of cleaved BTeO crystal showing the formation of polycrystalline cape due stagnant layer deficient in TeO2. The ratio of Te/Bi in that layer is 0.33 as measured by SEM/EDS, below the expected value of 0.50 for the crystal. Insert: micrograph of the cap revealing the microstructure characteristic of ceramics grain boundaries.
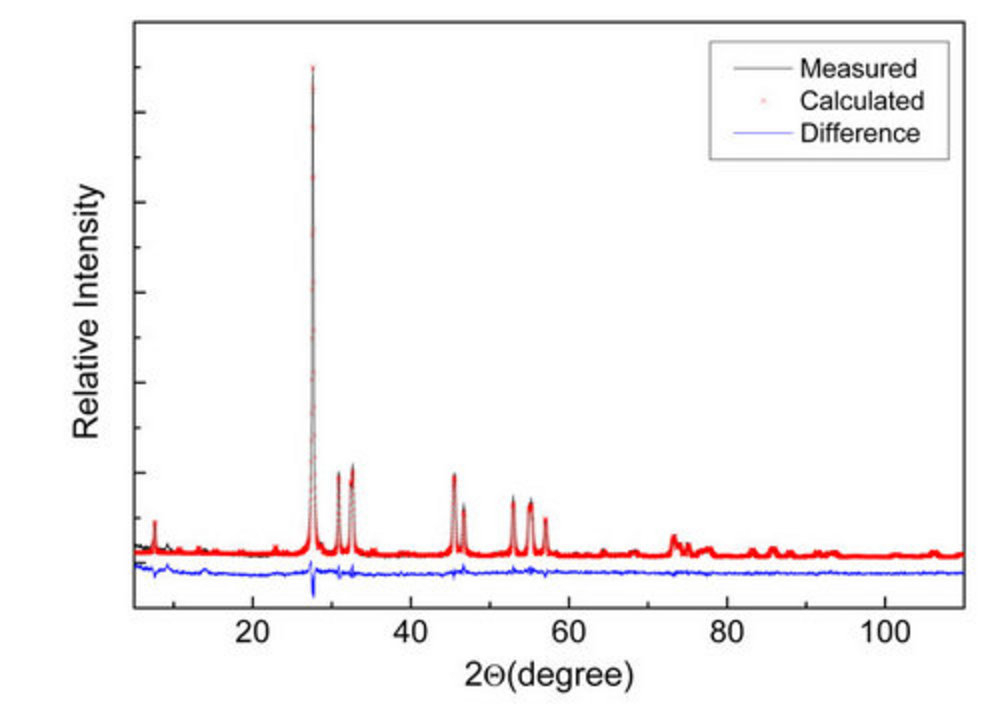
The furnace with low axial temperature gradient was preferred in order to perform the crystals growth closer to the equilibrium condition, favoring their structural perfection, and reducing the chance of damage due thermal stresses. The use of double crucible system proved to be effective in maintaining the melt composition near the stoichiometric one, enabling the growth of crystals at low pulling rates up to 10 days. Single crystal grown by the double crucible method using pulling rate of 0.3mm/h and 15 rpm rotation speed is shown in Figure 3(a), as-grown, presenting a very uniform pale yellow color. Figure 3(b) shows polished samples used for the optical measurements; they are free of macroscopic defects like voids, inclusions or sources of stress birefringence. X-ray powder diffraction combined with Rietveld refining confirmed the orthorhombic structure of crystals, see Figure 4, with calculated cell parameters a = 11,582(1) Å, b = 16,450(1) Å, and c = 5,522(1) Å, in good agreement with refs. [2, 10]. DTA/TG analyses show no occurrence of phase transition in the interval from room temperature to melting point, and confirmed the melting temperature as being Tm= 905 ± 5 oC. Thermogravimetric curve shows a strong loss of mass associated to evaporation of TeO2 above the melting point. In ref. [5] is pointed out that BTeO crystals present a wide range of optical transparency. This was confirmed by our optical transmission measurements carried out in a crystal with 0.4 mm thickness in the [100] direction, which showed a transmittance greater than 50% in the range of 450 nm to 2500 nm. The optical band gap of BTeO was calculated from the plot of (αhν)2 versus hν being Eg = 3.1 eV.

Figure 3 -(a) As-grown BTeO crystal using de double crucible method; (b) Polished samples used for the optical measurements.

Figure 4 - X-ray powder diffraction of BTeO crystal with Rietveld refining.
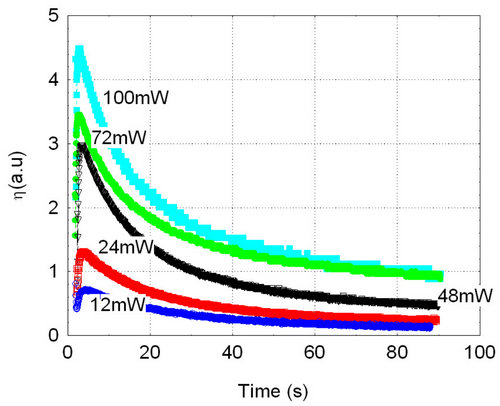
The grown BTeO crystal was shown to exhibit excellent properties as optical recording material. Holograms were recorded for 2 min with different total intensity beams (both recording beams of roughly similar intensity) and then erased using one of the recording beams. Hologram erasure curves displayed in Figure 5 show the typical behavior of hole-electron competition with holes and electrons being photoexcited from different photoactive centers in the crystal. The first fast growing part of the curves represents the erasure of the fast (presumably electron- based) hologram that puts into evidence the presence of the slower (presumably hole-based) hologram, where the maximum shows the point where the faster hologram has been completely erased and the erasure of the slower one, at a much slower rate, becomes evident. The peak in these curves approximately represents the maximum diffraction efficiency of the recorded slower hologram, that is roughly the same than that of the faster one in this case, once both seem to be roughly compensated (that is, of similar value) at starting of erasure.
 Figure 5 - Erasure, using one of the recording beams, of holograms being recorded with two λ = 532 nm beams of roughly similar intensities during 2 min, with different total beams intensities, always with a grating vector value K = 13 μm−1. The peak of the curve with the highest laser intensity roughly represents a diffraction efficiency η ≈ 50% and that for the lowest intensity is η ≈ 30%. Figure 5 - Erasure, using one of the recording beams, of holograms being recorded with two λ = 532 nm beams of roughly similar intensities during 2 min, with different total beams intensities, always with a grating vector value K = 13 μm−1. The peak of the curve with the highest laser intensity roughly represents a diffraction efficiency η ≈ 50% and that for the lowest intensity is η ≈ 30%.
4. Conclusion
In this work we successfully demonstrated that the use a double crucible approach, with tellurium oxide excess in the outer one, is adequate to minimize the effects of TeO2 evaporation during the crystal growth of BTeO. This was combined with the use of a furnace with low axial thermal gradient, in searching for a good compromise between low crystal pulling rates, to improve the structural quality of the crystals, and reduced rotation rate, to minimize the risk of crystal crack during growth. By this way, homogeneous and defect free crystalline samples were obtained and our results confirmed its adequacy for holographic recording.
Acknowledgments.
We acknowledge the financial support from Conselho Nacional de Desenvolvimento Científico e Tecnológico (CNPq), the Coordenação de Aperfeiçoamento de Pessoal de Ensino Superior (CAPES), the Fundação de Amparo à Pesquisa do Estado de Goiás (FAPEG), Fundação de Amparo à Pesquisa do Estado de São Paulo (FAPESP), and Fundo de Apoio ao Ensino, Pesquisa e Extensão da Universidade Estadual de Campinas (FAEPEX).
Bibliography
[1] W. Horn, I. Földvári and C. Denz, Journal of Physics D: Applied Physics 41 (2008) 224006.
[2] Kang Min Ok, N. S. P. Bhuvanesh, P. Shiv Halasyamani, Inorganic Chemistry 40 (2001) 1978.
[3] G. Mandula, L. Kovács, Á. Péter and E. Hartmann, Optical Materials 1 (1992) 161.
[4] B. Frit, M. Jaymes, G. Perez, P. Hagenmuller, Revue de Chimie Minérale 8 (1971) 453.
[5] I. Földvári, Á. Péter, R. Voszka, Journal of Crystal Growth 100 (1990) 75.
[6] Senlin Fu, Hiroyuki Ozoe, Journal of Materials Processing & Manufacturing Science 10 (2001) 107.
[7] Hongbing Chen, Rongsheng Li, Congxin Ge, Xiang Ge, Wei Xu, Journal of Crystal Growth 281 (2005) 303.
[8] S. Kumaragurubaran, D. Krishnamurthy, C. Subramanian, P. Ramasamy, Journal of Crystal Growth 209 (2000) 855.
[9] Á. Péter, O. Szakács, I. Földvári, L. Bencs, A. Munoz F, Materials Research Bulletin 31 (1996) 1067.
[10] D. Mercurio, M. El Farissi, B. Frit, P. Goursat, Materials Chemistry and Physics 9 (1983) 467.
[11] A.C. Larson, R.B. Von Dreele, General Structure Analysis System (GSAS), Los Alamos National Laboratory Report LAUR 86-748 (2000).
|


