| Search for content and authors |
InxGa1-xAs alloy fluctuation and quantum dot nucleation mechanism |
| Tomoya Konishi 1, Gavin R. Bell 1,2, Shiro Tsukamoto 1 |
|
1. Anan National College of Technology, Anan 774-0017, Japan |
| Abstract |
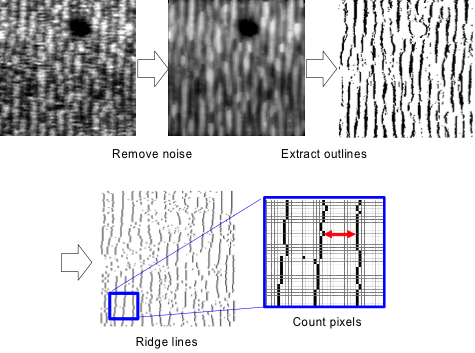
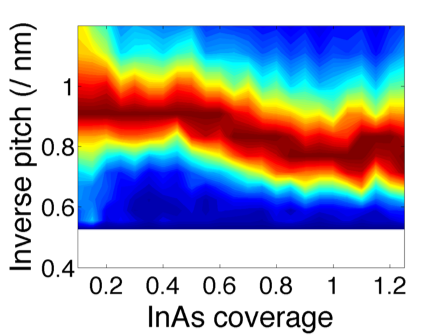
For optimal use of semiconductor quantum dots (QDs), it is desirable to arrange them in a highly dense and site-controlled array. However, important gaps remain in the understanding of the Stranski-Krastanow-like growth mechanism of InAs-GaAs QDs, particularly the effects of surface reconstruction (SR) in the wetting layer (WL) prior to QD nucleation. It is reported that the (n×3) SRs favour intermixing of Ga and In atoms. Furthermore, ab initio Monte Carlo simulations have shown that the migration barrier energy of mobile In adatoms becomes higher on Ga defects, implying that initial nucleation occurs preferentially on InxGa1-xAs alloy fluctuations within the WL, associated with (n×3) SR [1]. In order to test the ansatz experimentally, we carefully measured the spatial distribution of (n×3) SR in the WL using a unique scanning tunnelling microscopy / molecular beam epitaxy (STMBE) system. If QD nucleation is induced by (n×3) SR, it is likely that the spatial distribution of QD precursors resembles that of (n×3) SR [2]. In this study, we analyzed the spatial distribution of the SR on the 100×100 nm2 STMBE images by using image processing techniques (Fig. 1). The SR is distinguished by As dimer row pitch ((n×2) (c(4×4)), (n×3), (n×4) regions). We finally obtained a precise map of SR patterns. We demonstrate that the frequency distribution of the measured pitches is comparable with the RHEED patterns and Fourier transformed STM images (Fig. 2). From the SR map of WL, the spatial distribution function of (n×3) SR pattern was calculated and was compared to that of QD nucleation pattern. The similarity in the both functions suggested that QD nucleation is likely induced by InxGa1-xAs fluctuations forming (n×3) SR. [1] S. Tsukamoto, T. Honma, G. R. Bell, A. Ishii, and Y. Arakawa, Small 2 386 (2006). [2] T. Konishi, S. Tsukamoto, Surface Science 605 L1–L5 (2011).
Fig. 1: Schematic diagram of surface reconstruction map generation on an example 20×20 nm2 region.
|
| Legal notice |
|
| Related papers |
Presentation: Oral at 17th International Conference on Crystal Growth and Epitaxy - ICCGE-17, General Session 8, by Tomoya KonishiSee On-line Journal of 17th International Conference on Crystal Growth and Epitaxy - ICCGE-17 Submitted: 2013-04-15 13:18 Revised: 2013-04-15 15:34 |