| Search for content and authors |
Evidence of chaotic structure in the S&P 500 price-index: a horizontal visibility graph approach |
| Michail D. Vamvakaris 1, Athanasios Α. Pantelous 1, Konstantin M. Zuev 2 |
|
1. The University of Liverpool (UOL), Oxford Street, Liverpool L697ZD, United Kingdom |
| Abstract |
| In this paper, we study the behavior of the S&P 500 price-index series via the Horizontal Visibility Graph (HVG) method and we provide strong evidence that the behavior of the S&P 500 stock index is similar to a noisy low dimensional chaotic process for the time span between January, 2nd, 1996 and March, 13th, 2016. Further, we study the local behavior of the index series being particularly interested on how financial crises that happened worldwide affected the properties of the index series. Results shows that financial crises that originated outside of US affected considerably the behavior of the index while financial crises that originated in US do not alter the behavior of the index in a significant manner.
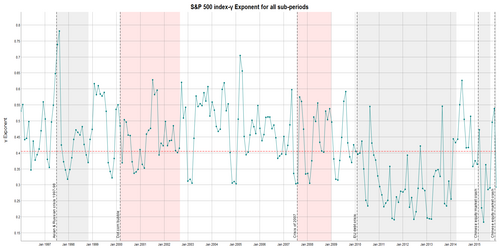
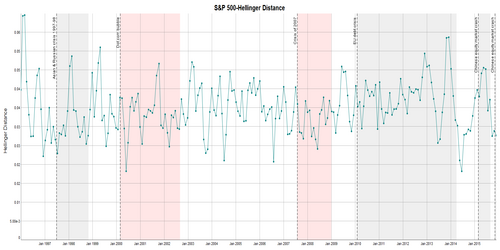
Horizontal Visibility Graph is a method that maps a time series into a network that inherits some properties of the original time series introduced in [1]. This method is based on simple geometric criterion based on which, two arbitrary data observation (ya, ta) and (yb, tb) in a time series become nodes in the associated graph and are connected to each other only if the following condition is fulfilled: ya, yb > yc for all other (yc, tc) such that ta<tc<tb. It has been shown [2] that uncorrelated (or correlated) stochastic and chaotic series are mapped into scale-free network with a power law degree distribution in the form of P(k)=exp(-γκ). If the value of the exponent γ=ln(3/2) then, the time series under study is an uncorrelated stochastic series. Values of the γ<ln(3/2), indicate that the series has the same properties with a chaotic series while the value of the exponent γ gives us an insight regarding the dimensionality of the chaotic attractor since as γ approaches asymptotically ln(3/2) the dimensionality of chaos increases. In case that γ>ln(3/2), the series is a correlated stochastic series with higher values of the γ exponent indicating higher degree of autocorrelation within series observations. In addition, HVG method is a tool for discriminating between reversible and irreversible series and further, for irreversible series we can quantify the degree of irreversibility by calculating the Hellinger distance between the in- and out- degree distributions of the associated directed HVG, where the higher the value of the Hellinger distance, the higher the degree of asymmetry underlying a series. Theoritically speaking, for reversible series of infinite length the Hellinger distance between the two distributions is zero. The purpose of this study if twofold. First, we study the properties of the S&P 500 index for the whole interval under study i.e. we calculate the γ exponent of the degree distribution of the associated HVG and the Hellinger distance between the in- and out- degree distribution of the assotiated directed HVG. Then, using the rolling window methos, we study the local properties of the index series and we pay attention on how financial crises affect the properties of the index series. For the purpose of this research we have used 5-min data for the S&P 500 from January 1996 to March 2016.In particular, we found that the exponent of the index series over the whole period under study is which implies that the series has the same properties with a chaotic process. In addition, the Hellinger distance between the in- and out- degree distribution was found to be , which is much higher than the corresponding values for reversible series but at the same time it is too low in comparison with other chaotic processes. So, in short, the series under study can be characterized as noisy dissipative chaotic process. The fact that the index series is found to be irreversible reveals that the index can be described as an out-of-equilibrium dynamic system. In particular, we found that the γ exponent of the index series over the whole period under study is γ=0.206 which implies that the series has the same properties with a chaotic process. In addition, the Hellinger distance between the in- and out- degree distribution was found to be H=0.0136, which is much higher than the corresponding values for reversible series but at the same time it is too low in comparison with other chaotic processes. So, in short, the series under study can be characterized as noisy dissipative chaotic process. The fact that the index series is found to be irreversible reveals that the index can be described as an out-of-equilibrium dynamic system. In Fig. 1 and 2, we plot the values of γ exponent and Hellinger distance for all sub-periods. Shadowed regions denote periods of financial crises. Grey shadowed regions represent financial crises that took place abroad while red shadowed regions represent market crashes following a stock market bubble happened in US. We observe that γ exponent lies in the chaotic band mainly when a crisis is ongoing abroad. In particular, it is obvious that within the grey shadowed regions the exponent have values γ<ln(3/2), while irreversibility peaks during the corresponding periods. On contrary, red shadowed regions do not contain that high percentage of windows exhibiting chaotic behavior while irreversibility fluctuates at lower levels in comparison with the grey shadowed regions. Based on these graphs the conclusion one can draw is that external shocks trigger a chaotic behaviour in the index series while internal shocks do not seem to affect the properties of the index series considerably.
Figure 1: Values of exponent γ for all windows for the S&P 500 price-index. In the vertical axis it is plotted values of γ exponent and on the horizontal line we plot the last date of each window. The red line represents the value γ=ln(3/2) which correspond to an uncorrelated random process. Red shadowed regions represent periods of market crashes following a market bubble in US and grey shadowed regions represents periods of financial crisis that took place abroad.
Figure 2: Values of the Hellinger distance (H) between the in- and out- degree distribution for all windows for the S&P 500 price-index. In the vertical axis it is plotted values of H and on the horizontal line we plot the last date of each window. Red shadowed regions represent periods of market crashes following a market bubble in US and grey shadowed regions represents periods of financial crisis that took place abroad. Bibliography [1] Luque, B., Lacasa, L., Ballesteros, F. and Luque, J., 2009. Horizontal visibility graphs: Exact results for random time series. Physical Review E, 80(4), p.046103. [2] Lacasa, L. and Toral, R., 2010. Description of stochastic and chaotic series using visibility graphs. Physical Review E, 82(3), p.036120. |
| Legal notice |
|
Presentation: Oral at Econophysics Colloquium 2017, Symposium C, by Michail D. VamvakarisSee On-line Journal of Econophysics Colloquium 2017 Submitted: 2017-03-14 19:14 Revised: 2017-03-14 21:10 |