| Search for content and authors |
Causal Inference of Market Event Rates in Foreign Currency Market |
| Jean-Francois Boilard 1, Kiyoshi Kanazawa 1, Hideki Takayasu 1,2, Misako Takayasu 1 |
|
1. Tokyo Institute of Technology, Nagatsuda-Cho 4259,Midori-ku, Yokohama, Yokohama 226-8502, Japan |
| Abstract |
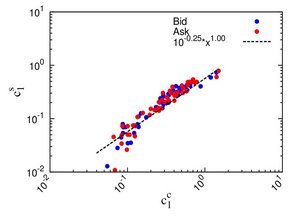
In recent years, the technological development directly have impact on the interaction between market participants. In most financial markets, automatic execution systems have shown presence over 95% in Electronic Broking Services (EBS) Foreign Currency Market. One of the main consequence is the increase in speed of the decision making process of the market as a whole. These days, researchers have now access to precise dataset and study the detail of fluctuation dynamic of the order book. In this research, we analyze the entire order book of EBS Currency Market in isolating incoming limit orders, transactions triggered by market orders, and annihilation of queuing limit orders. More specifically, we inferred the causal interaction between those market events. We use a database provided by EBS/NEX, which is one of the most active interdealer brokers in Spot Foreign Exchange Market. This database covers three weeks of 2011 with time granularity of one millisecond. Moreover, we have access to order identification which permits us to track orders from their submission to annihilation. In this research, we focus on the Euro(EUR)/US dollar(USD), USD/Japanese yen(JPY), and EUR/JPY currency pairs in particular. We calculate the frequency rate per unit time of market events using a time window of one hour. Figure 1 compares the cancellation and submission rates. The blue (bid) and red (ask) points are the the one hour rate for the USD/JPY currency pair. We observe a clear linear scaling relation between both events. We follow the same procedure for every interaction for market events, and we isolate the real impact of one parameter on another in using Granger Causality techniques.
Figure 1: Log-log plot of the cancellation parameter (x-axis) and submission parameter (y-axis). The blue and red points are respectively the bid and ask with one hour time window. The dashed line is the approximation of the scaling relation. |
| Legal notice |
|
| Related papers |
Presentation: Oral at Econophysics Colloquium 2017, Symposium A, by Jean-Francois BoilardSee On-line Journal of Econophysics Colloquium 2017 Submitted: 2017-03-06 06:50 Revised: 2017-03-16 05:08 |