| Search for content and authors |
The phenomenon of thermal unstability in Czochralski hydrodynamic model: physical and numerical simulation |
| Nataliya A. Verezub 1, Anatoly I. Prostomolotov 2, Vladimir S. Berdnikov 3 |
|
1. Institute for Problems in Mechanics RAS (IPMECH), Vernadskii prospect 101, bl. 1, Moscow 119526, Russian Federation |
| Abstract |
Formation of the microdefect's striations in crystals grown by Czochralski (Cz) method is connected with the instability of a melt flow, which causes the time-instability of liquid/solid interface and pulsating dopant flux from a melt into crystal. This problem is the subject of many experimental and theoretical papers that analyze the temperature fluctuations in a melt for concrete conditions of Cz crystal growth [1]. However, modern Cz numerical simulations use the multi-conjugated models, which are very complicated for detailed analysis of the flow instabilities in a melt. Their verification by means of experimental data obtained in complex technological conditions, in our opinion, gives only the qualitative notion about the correlation of calculated and experimental data. In this paper the problem of flow instability is considered on the basis of Cz numerical hydrodynamic model. Its mathematical formulation fully corresponds to the laboratory experiment [2]. The study was carried out by using of modeling liquid (ethanol). The liquid fills the cylindrical crucible of the radius 0.1475 m till the height 0.1032 m. The disk of the radius 0.0536 m is located on the liquid surface coaxially with the crucible. Thermal conditions are following: the disk temperature Ts = 300 K, the crucible bottom is thermally insulated, and its lateral wall is heated to the temperature Tw = Ts + ΔT. The flow structure is caused by the thermal gravitational convection and Marangoni convection under the action of thermocapillary forces on the free liquid surface. The transition to the hydrodynamic unstable flows is studied at variation of the temperature difference between the lateral crucible wall and the disc for the range ΔT = 1 ¸ 15 K.
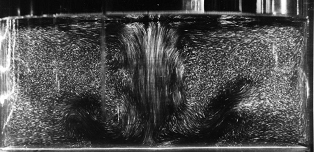
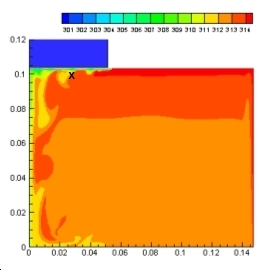
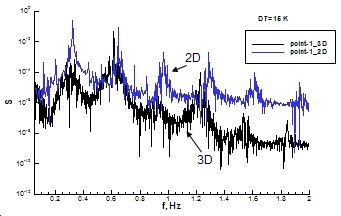
Fig. 1. The experimental picture of unstable flow structure. The detailed description of the experiment is given in [2]. The according flow structure was visualized by finely dispersed aluminum particles (Fig. 1), and the temperature measurements were carried out by means of thermocouples located near the disk. Numerical simulation was carried out by means of control volume method for a solution of Navier-Stokes and heat transfer equations in Boussinesq’s approximation [3]. The axisymmetric and three-dimensional formulations of the problem were considered. The transitions of a steady flow and heat transfer to their unstable modes with the emergence and development of temperature fluctuations were investigated. The special subroutines of statistical treatment were applied for the calculation of average characteristics and a spectral power of velocity and temperature fluctuations. In a clear graphic form an evolution of thermic was visualized: the formation, development and its tearing from the disk surface, the essence of which is as follows. In gravity field the inhomogeneity of temperature distribution in the crucible causes the melt motion under the action of gravitational thermal convection, which is amplified by the additional influence of thermocapillary forces at the free liquid surface. As a result, the liquid is heated and lifted up near the lateral crucible wall. Then it moves in the radial direction to the cold disk. Under this disc the cooled liquid drops to the bottom. The peculiarity of this flow is a presence of cooled liquid jet having the specific form in the crucible center (near the axis), which extends from the lower disk edge to the crucible bottom. Under the disc the jet structures undergo the specific changes with increasing ΔT from 4 to 15 K. This jet steadily achieves the crucible bottom without losing its initial form at the small value of ΔT = 4 K. The essential radial changes of its shape become visible with removal down from the disk at the greater values of ΔT = 10 and 15 K. These spatial changes of downflow are time-dependent, too. At ΔT = 15 K the time dependence of temperature contours near the crucible bottom becomes clearly noticeable. It is accompanied by a radial turning of the jet from the axis to the lateral wall. The experimental video shows that the pattern of instability in the flow structure according to the mechanism of formation, development and tearing of thermics from the disc is similar the formation of a liquid droplet on an icicle, and its periodic tearing from its surface. Similar experiments were carried out at some different geometry of the model and with using of silicone oil. Their data show a similar pattern of flow instability [4]. Fig. 2. The calculated instantaneous picture of temperature contours with its values at ΔT = 15 K. Here: ´ is the location of “point-1” temperature sensor at r = 0.0268 m, z = 0.0982 m. Fig. 2 shows the calculated instantaneous picture of temperature contours at ΔT = 15 K, at which the process of thermics development is clearly visible under the cold disk: thermic's formation near the disk edge, its increase towards the center and then its tearing from the disk near the central downflow. The calculated spectral power of temperature fluctuations in “point-1” at ΔT = 15 K is shown in Fig. 3. This spectrum was plotted on basis of the records in “point-1” (see Fig. 2) of temperature fluctuations, which have been resulted from the axisymmetric and three-dimensional calculations. The spectrum of temperature fluctuations is noticeably discrete. In it the frequencies with the highest spectral power of temperature fluctuations are distinguished.
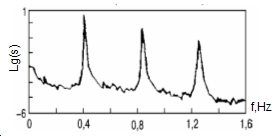
Fig. 3. The calculated spectral power of temperature fluctuations in “point-1” at ΔT = 15 K. Here: 2D – axisymmetric and 3D – three-dimensional cases. The experimental data (Fig. 4), corresponding to the discrete spectrum of laminar-turbulent transition, are in good agreement with these calculated results. In comparison with the calculated spectrum it may be noted a small shift of frequencies in experimental data. It may be explained by some difference of the location of “point-1” and the experimental sensor near the disk. The experimental data (Fig. 4), corresponding to the discrete spectrum of laminar-turbulent transition, are in good agreement with these calculated results. In comparison with the calculated spectrum it may be noted a small shift of frequencies in experimental data. It may be explained by some difference of the location of “point-1” and the experimental sensor near the disk. Fig. 4. The experimental spectral power of temperature fluctuations for unstable flow structure shown in Fig. 1. The instantaneous three-dimensional picture for the process of formation and development of thermics may be illustrated by Fig. 5, which shows the discrete azimuthal distribution of thermics under the disc. Such distribution of thermics differs from their uniform azimuthal distribution for axially symmetric case. Fig. 5. The spatial picture of thermics under the disk in 3D-calculation, which has been plotted as isothermal surface at T = 312 K. The frequency distribution of the spectral power in axisymmetric case is approximately similar to three-dimensional one, but its power values are somewhat smaller in three-dimensional case (Fig. 3). This distinguishing feature of three-dimensional results is explained by the presence of azimuthal inhomogenity in distribution of thermics. Acknowledgments We thank the Russian Foundation for Basic Research for the financial support of projects: 11-08-00966, 12-02-01126. References [1] Miller W. Numerical simulation of bulk crystal growth on different scales: silicon and GeSi // Phys. Status Solidi B. 2010. V. 247. N 4. P. 885-869. [2] Berdnikov V.S. Hydrodynamics and heat transfer during crystal pulling from a melt. Part 1. The experimental study of natural convection // Materials of Electronic Technics. 2007. N 4. P. 19-27 (in Russian). [3] Devdariani M.T., Prostomolotov A.I., Fryazinov I.V. Finite difference method and program realization for solving three-dimensional Navier-Stokes equations in the cylinder // Proceedings of 1990 IMACS international conference “Mathematical Modeling and Applied Mathematics”. Elsevier Science B.V. 1992. P. 119-132. [4] Teitel M., Schwabe D., Gelfgat A.Yu. Experimental and computational study of flow instabilities in a model of Czochralski growth // J. Crystal Growth. 2008. V. 310. P. 1343-1348. |
| Auxiliary resources (full texts, presentations, posters, etc.) |
|
| Legal notice |
|
| Related papers |
Presentation: Poster at 17th International Conference on Crystal Growth and Epitaxy - ICCGE-17, General Session 1, by Nataliya A. VerezubSee On-line Journal of 17th International Conference on Crystal Growth and Epitaxy - ICCGE-17 Submitted: 2013-03-28 17:20 Revised: 2013-07-19 00:09 |